Digital agency analytics: your 2026 strategy guide
Unlock the power of digital agency analytics in 2026. Transform data into actionable insights to boost client retention and drive growth.

TL;DR:
Digital agency analytics transforms raw performance data into actionable insights that enhance campaign decisions and client relationships. Agencies that focus on 3–5 goal-aligned KPIs, automate data collection, and combine automated reports with human commentary achieve better client retention and growth. Incorporating competitive intelligence, clear reporting structures, and strategic narratives ensures more effective, trustworthy, and scalable agency analytics.
Digital agency analytics is the practice of transforming raw client performance data into clear, structured insights that guide campaign decisions and strengthen agency-client relationships. For marketing professionals and data analysts managing multiple accounts, the discipline goes well beyond pulling numbers from Google Ads or Meta. It requires selecting the right metrics, automating data collection reliably, and communicating findings in a way clients actually understand. Agencies that treat analytics as a reporting discipline, with defined ownership and quality standards, consistently see better client retention and more organic growth. This guide covers the full workflow, from KPI selection through to advanced techniques shaping the field in 2026.
What are the best practices for selecting and standardising client KPIs?
The most common analytics mistake agencies make is tracking too many metrics. Reporting on 20 data points per client does not demonstrate thoroughness. It creates noise that obscures the signal clients actually need to see.

The right approach is to focus on 3–5 priority KPIs tied directly to each client's business goal. An e-commerce client cares about return on ad spend, cost per purchase, and revenue attributed to paid channels. A lead generation client cares about cost per qualified lead, lead-to-close rate, and pipeline value. Vanity metrics like impressions and follower counts belong in an appendix at best.
Standardising these KPIs across your agency requires a canonical KPI dictionary. This is a shared document that defines every metric precisely: how it is calculated, which platform it pulls from, and how it maps to business outcomes. Without this, two analysts on the same account will report the same metric differently, and clients will notice the inconsistency.
KPI alignment must happen during client onboarding, not after the first report lands. Present your proposed KPI set, explain why each metric matters, and get written sign-off. This single step prevents the most common source of client dissatisfaction: the feeling that the agency is measuring the wrong things.
E-commerce KPIs: Return on ad spend, cost per purchase, cart abandonment rate, customer acquisition cost
Lead generation KPIs: Cost per qualified lead, lead volume, lead-to-opportunity rate, pipeline contribution
Brand awareness KPIs: Share of voice, branded search volume, reach, video completion rate
Universal KPIs: Channel-attributed revenue, conversion rate, month-on-month growth
Pro Tip: Build your KPI dictionary in a shared workspace like Notion or Confluence, and link to it directly from every client report. Clients who can look up metric definitions themselves ask fewer clarifying questions and trust the data more.
How to implement automated, reliable data collection in agency analytics
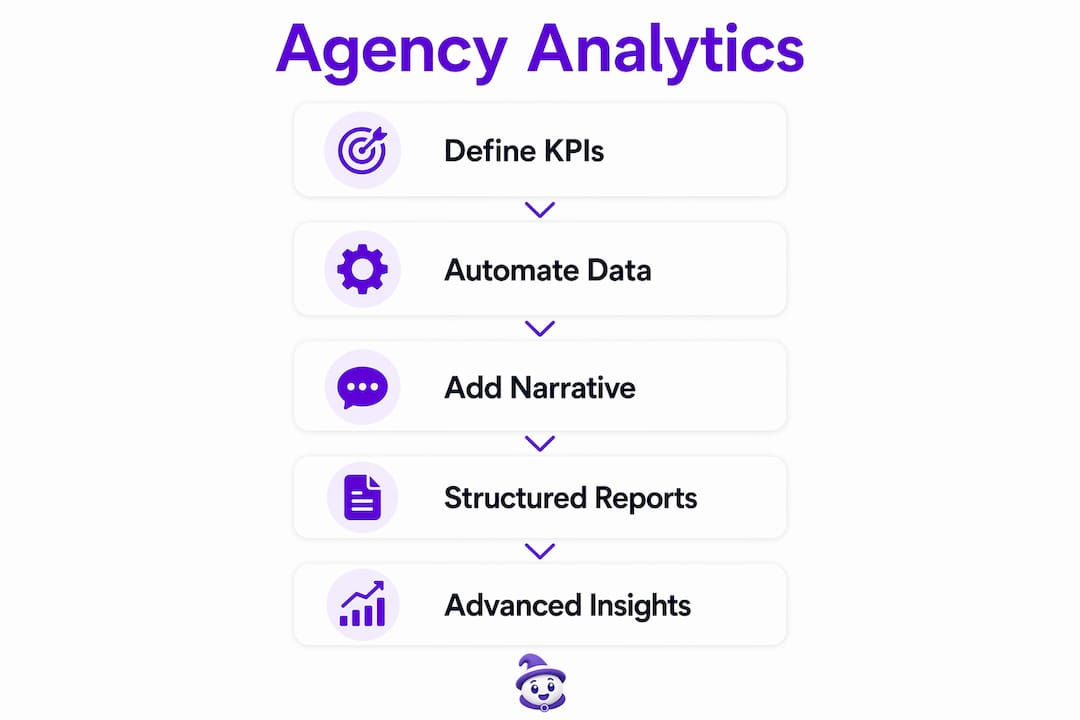
Automation is the operational foundation of any agency managing more than five clients. Manual data pulls from Google Ads, Meta, LinkedIn, and CRM platforms are slow, error-prone, and expensive in senior analyst time. Automating routine data pulls can reduce senior strategist hours by 60–70% and improve report delivery speed. That time saving translates directly to margin, given that the median agency gross margin sits at around 25%.
The architecture for reliable data collection follows a clear sequence.
Connect platform APIs to a central data warehouse. Tools like BigQuery or Snowflake act as the single source of truth. Every platform, Google Ads, Meta, HubSpot, Shopify, feeds into one location.
Normalise disparate metrics into a unified schema. "Conversions" means something different on Meta than it does in Google Analytics 4. Map each platform's terminology to your agency's canonical definitions before any data reaches a dashboard.
Apply attribution window rules consistently. Conversion data on platforms like Meta carries a 24–72 hour attribution lag. Reporting immediately after a campaign ends will undercount conversions. Apply a minimum 48-hour delay before pulling final conversion figures.
Schedule automated quality checks. Set alerts for data gaps, sudden metric spikes, or missing platform connections. A broken API feed that goes unnoticed for a week corrupts an entire month's report.
Document every data transformation. When a client's CRM shows different conversion numbers than your dashboard, you need a clear audit trail to explain why. Attribution mismatches are one of the most common causes of client distrust, and transparent documentation is the fastest way to resolve them.
Pro Tip: Run a monthly cross-check between your dashboard conversion totals and the client's CRM. Discrepancies above 10% signal an attribution or tracking issue that needs fixing before the next report goes out.
What role does human narrative play in digital agency reporting?
Automation handles data delivery. It does not handle meaning. This is the distinction most agencies miss when they invest in reporting tools and then wonder why clients still feel disconnected from their results.
Full automation of client reporting commentaryharms client trust. Automated exports show what happened. They do not explain why it happened, what it means for next month, or what the agency plans to do about it. Clients who receive data without context either ignore the report or start questioning the agency's value.
The hybrid model works best. Automated pipelines handle data ingestion, visualisation, and dashboard updates. A strategist then writes a concise narrative layer on top, typically 200–400 words, that covers three things: what changed, why it changed, and what happens next.
"The ideal reporting workflow fully automates data reception and visualisation but preserves manual strategic narrative to interpret and recommend based on data. Agencies that match automated pipelines with human commentary retain more clients and generate more upsell conversations."
Effective strategic commentary follows a consistent pattern. Each section of the narrative should do one of the following:
Identify a key development. "Paid search cost per lead dropped 18% this month, driven by the new ad copy test on the brand campaign."
Explain the cause. "The improvement correlates with the audience exclusion list we applied on 3 march, which removed low-intent traffic from the retargeting pool."
Recommend a next step. "We recommend increasing the brand campaign budget by 15% in april to capitalise on this efficiency gain before the competitor's seasonal push."
The common pitfall is treating narrative as optional. Agencies that skip it because "the dashboard speaks for itself" consistently see higher client churn. Clients do not read dashboards. They read emails. A concise monthly email with a live dashboard link attached outperforms a standalone dashboard every time.
How to design client reporting frameworks that improve clarity and retention
Standardising reporting architectureby client goals rather than by metrics improves client satisfaction and cuts reporting time by more than 50%. The architecture matters as much as the data inside it.
The four-act reporting method gives every report a clear structure that clients can navigate without guidance.
The four-act structure
Act 1: Headline. One sentence stating the overall performance verdict. "March was your strongest paid search month in six months, driven by a 22% reduction in cost per lead." Clients read this first. Make it count.
Act 2: Key metrics. A concise table showing 3–5 KPIs, current period versus prior period, with a simple trend indicator. No more than five rows. Clients scan this in under 30 seconds.
Act 3: Analysis. Two to three paragraphs of narrative explaining the drivers behind the numbers. This is where the strategist's voice matters most.
Act 4: Recommendations. Three to five specific actions for the next period, each tied to a metric. "Increase retargeting budget by £500 to maintain the conversion rate improvement seen in week three."
Report element | Format | Purpose |
|---|---|---|
Headline | One sentence | Sets the performance verdict immediately |
Key metrics table | 3–5 rows, two periods | Gives clients a scannable data summary |
Analysis narrative | 200–300 words | Explains causes and context |
Recommendations | Bullet list, 3–5 items | Drives next-period decisions |
Clients overwhelmingly prefer concise, insight-focused summaries over lengthy PDF decks. Ninety percent of clients adopt simplified reporting formats when given the choice. That figure reflects a fundamental shift in how clients want to consume agency work.
Live dashboard links serve a different purpose from the monthly report. They give clients real-time access to their data between reporting cycles, which reduces ad hoc data requests and builds transparency. The monthly report provides interpretation. The dashboard provides access. Both are necessary.
Pro Tip: Create a master report template with your agency's branding, then allow one design variation per client for their logo and colour palette. Standardised architecture with personalised presentation signals professionalism without adding production time.
What advanced techniques elevate agency analytics in 2026?
The agencies pulling ahead in 2026 are not just reporting on their own campaigns. They are contextualising client performance against the broader market. Adding competitive intelligence to reports shifts client perception from passive recipient to strategic partner. A competitive signal section, even a brief one covering share of voice or competitor ad activity, demonstrates market awareness that clients cannot easily replicate themselves.
Financial reporting integration is the next frontier for agencies serious about growth. Blending sales pipeline data with financial forecasting produces more predictable revenue and gives agency leadership a clearer picture of account health. Tracking project profitability alongside campaign performance reveals which accounts are genuinely profitable and which are consuming disproportionate resource.
Scaling analytics automation beyond 30 clients introduces engineering complexity that most agencies underestimate. The data warehouse connections, normalisation rules, and quality checks that work for 10 clients require dedicated maintenance at 50. Agencies at this scale need either a dedicated analytics engineer or a platform built specifically for agency reporting workflows.
The most pressing technical challenge for 2026 is attribution model alignment. As third-party cookie deprecation reshapes measurement across platforms, agencies must document their attribution assumptions clearly and revisit them quarterly. Clients who understand the limitations of current measurement are far less likely to dispute results.
Competitive intelligence: Include a brief share-of-voice or competitor activity summary in monthly reports to contextualise client performance
Financial integration: Track utilisation rates and project profitability alongside campaign KPIs to identify margin risks early
Attribution documentation: Maintain a written record of attribution model choices, measurement windows, and known data gaps for every client
AI-assisted analysis: Use AI tools to surface anomalies and draft narrative sections, but always have a strategist review before sending
Scaling governance: Assign a named analytics owner for every client account to maintain data quality as the agency grows
Mycontentlab addresses the AI-assisted analysis challenge directly. Its platform converts raw performance data into draft content ideas, narrative hooks, and recommendations, giving strategists a starting point rather than a blank page. Agencies using Mycontentlab's analytics tools report sharper reporting output and faster turnaround on monthly deliverables.
Key takeaways
Effective digital agency analytics requires a hybrid model that combines automated data pipelines with human narrative, structured reporting frameworks, and clear KPI alignment agreed with clients at onboarding.
Point | Details |
|---|---|
Limit KPIs to 3–5 per client | Focus on goal-aligned metrics and agree them in writing during onboarding. |
Automate data collection, not commentary | Use APIs and data warehouses for ingestion; preserve human narrative for context and recommendations. |
Apply attribution delay rules | Allow a minimum 48-hour delay on conversion data to avoid undercounting in post-campaign reports. |
Use the four-act report structure | Headline, key metrics, analysis, and recommendations give every report a clear, scannable shape. |
Add competitive context | Including market intelligence in reports shifts client perception and reduces churn. |
Why I think most agencies are still reporting backwards
After working across dozens of agency reporting setups, the pattern I see most often is agencies building their reports around the data they have, rather than the questions their clients are actually asking. The result is technically accurate reports that clients find useless.
The shift that changes everything is treating the client's business goal as the starting point and working backwards to the metrics. A client running a lead generation campaign does not care about impressions. They care about pipeline. Every metric in the report should connect, directly or indirectly, to that pipeline number. When it does not, cut it.
The second thing I have learned is that clients who understand their own data stay longer. Agencies that invest time in educating clients on metric definitions, attribution assumptions, and what the numbers actually mean build relationships that survive bad months. Clients who do not understand their data panic when results dip and blame the agency. The fix is not better results. It is better communication, delivered consistently from month one.
Reporting quality is a growth lever, not just a deliverable. The agencies I have seen grow fastest treat their reporting process with the same rigour they apply to campaign execution. They have templates, owners, quality checks, and review cycles. They create client reports with the same intentionality they bring to ad creative. That discipline compounds over time into retention, referrals, and upsell revenue that no amount of new business development can replicate.
— Amir
How Mycontentlab supports your agency reporting workflow
Agencies that want to move faster without sacrificing report quality need a platform built for their specific workflow.
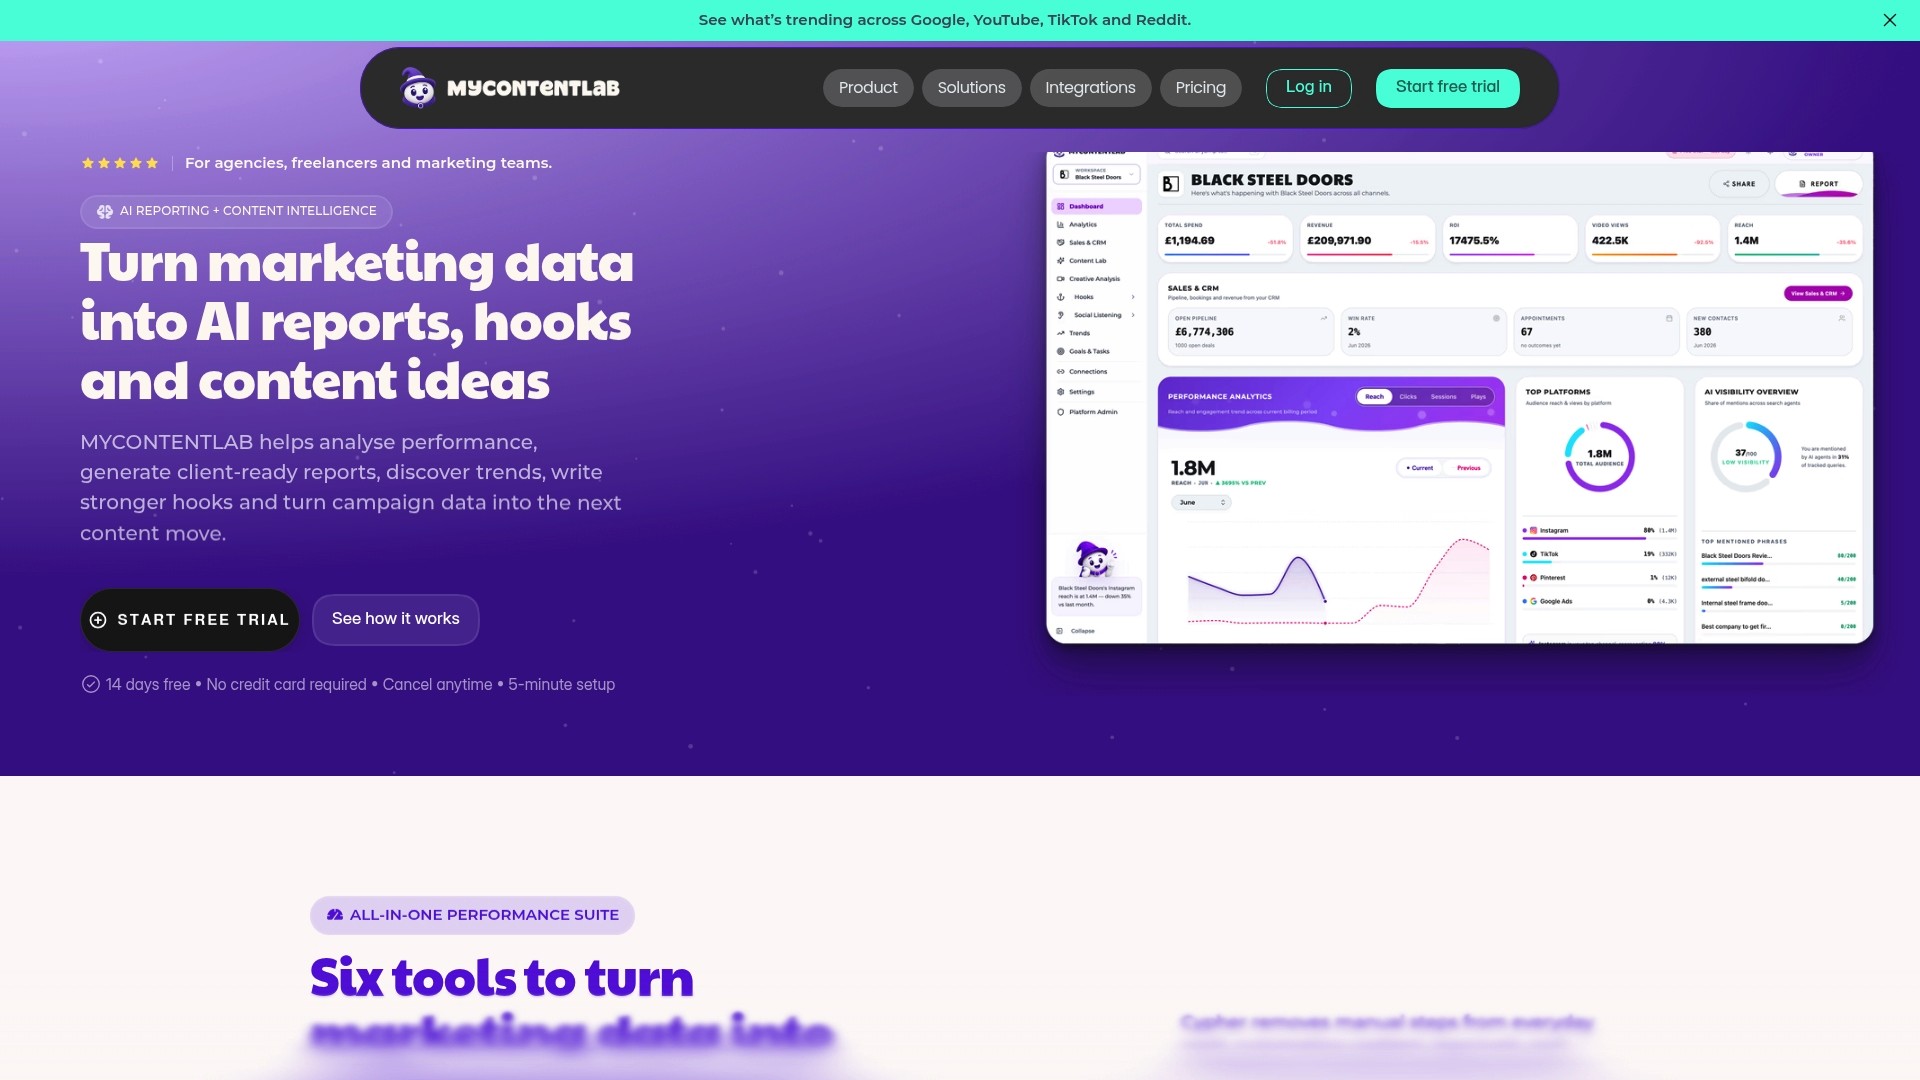
Mycontentlab is built for marketing professionals and data analysts who need to turn performance data into client-ready reports without spending hours on manual formatting. The platform automates the reporting process, converting scattered metrics into structured, client-ready outputs that include narrative hooks and recommendations generated directly from real campaign data. Agencies using Mycontentlab reduce reporting time significantly while improving the clarity and consistency of what clients receive. For teams managing multiple accounts, it provides the operational foundation that makes hybrid reporting, combining automated data with human narrative, genuinely practical at scale.
FAQ
What is digital agency analytics?
Digital agency analytics is the process of collecting, normalising, and communicating client performance data to generate insights that improve campaign outcomes and client retention. It covers KPI selection, data automation, reporting design, and strategic narrative.
How many KPIs should an agency report on per client?
Agencies should report on 3–5 priority KPIs per client, selected based on the client's specific business goal. Reporting on more than five metrics per client typically reduces clarity and increases the risk of clients focusing on vanity data.
Why does full automation of client reports cause problems?
Fully automated reports deliver data without context. Clients need to understand why results changed and what the agency recommends next. Manual narrative added by a strategist provides that context and is directly linked to stronger client retention.
How should agencies handle attribution discrepancies between platforms and CRM data?
Attribution discrepancies are most often caused by mismatched measurement windows or different attribution models across platforms. Agencies should document their attribution assumptions clearly, apply consistent measurement windows, and run monthly cross-checks against the client's CRM to catch gaps early.
What is the four-act reporting method?
The four-act reporting method structures every client report into four sections: a headline verdict, a key metrics table, an analysis narrative, and a set of specific recommendations. This format gives clients a clear, scannable report they can act on without additional explanation.
Recommended


Jul 19, 2026


Search



You can also read
Category
All
Compare
Marketing Reporting
Agency Operations
Content Intelligence
Brand Monitoring
Platform Reporting