PPC analysis: a practical guide for marketing teams
Unlock the power of PPC analysis. Learn how to evaluate campaign data, maximise conversions, and cut wasted budget effectively.

TL;DR:
Proper PPC analysis evaluates campaign data to identify waste and improve ROI. Regular audits and focusing on metrics like POAS and CLV ensure profitability and prevent misleading conclusions. Accurate tracking and structured reviews are crucial for optimising ad performance and maximising budget efficiency.
PPC analysis is the systematic evaluation of pay-per-click campaign data to identify what drives results and what wastes budget. Done well, it shifts decision-making from gut instinct to evidence. The core metrics that matter include ROAS, POAS, conversion rate, cost per acquisition, and customer lifetime value. As of Q2 2026, £1 in every £6 of UK Google Ads search spend produced no conversions at all. That figure alone makes the case for rigorous, regular campaign analysis.
What metrics matter most in PPC analysis?
The most important PPC performance metrics are not always the most visible ones. Click-through rate and impression volume are easy to find in any dashboard, but they tell you nothing about profitability. The metrics that drive real decisions are ROAS, POAS, conversion rate, cost per acquisition, and customer lifetime value.

ROAS, POAS, and why the difference matters
ROAS (return on ad spend) measures revenue generated per pound spent on ads. It is a useful starting point, but it ignores gross margins entirely. A campaign generating £5 for every £1 spent looks healthy until you factor in a 15% margin. Shifting from ROAS to POAS (profit on ad spend) gives a far more accurate picture of true campaign profitability. E-commerce accounts typically target ROAS between 400% and 600%, while service businesses often find profitability at a 2:1 to 3:1 POAS ratio.
Customer lifetime value (CLV) adds another layer. A customer acquired at a high cost per acquisition may still be profitable if they return repeatedly. The generally accepted healthy ratio of CLV to customer acquisition cost is 3:1 or greater. Tracking CLV alongside acquisition cost prevents the common mistake of cutting campaigns that appear expensive but actually generate loyal, high-value customers.
Conversion rate and quality score
Conversion rate is the percentage of clicks that complete a desired action, whether that is a purchase, a form submission, or a phone call. UK search campaigns typically benchmark at a 3–8% conversion rate, with CTR sitting at 3–6%. These ranges are useful for orientation, but benchmarking against your own historical data is more reliable than external industry figures. Internal trends reveal whether your account is improving or declining, regardless of what competitors are doing.
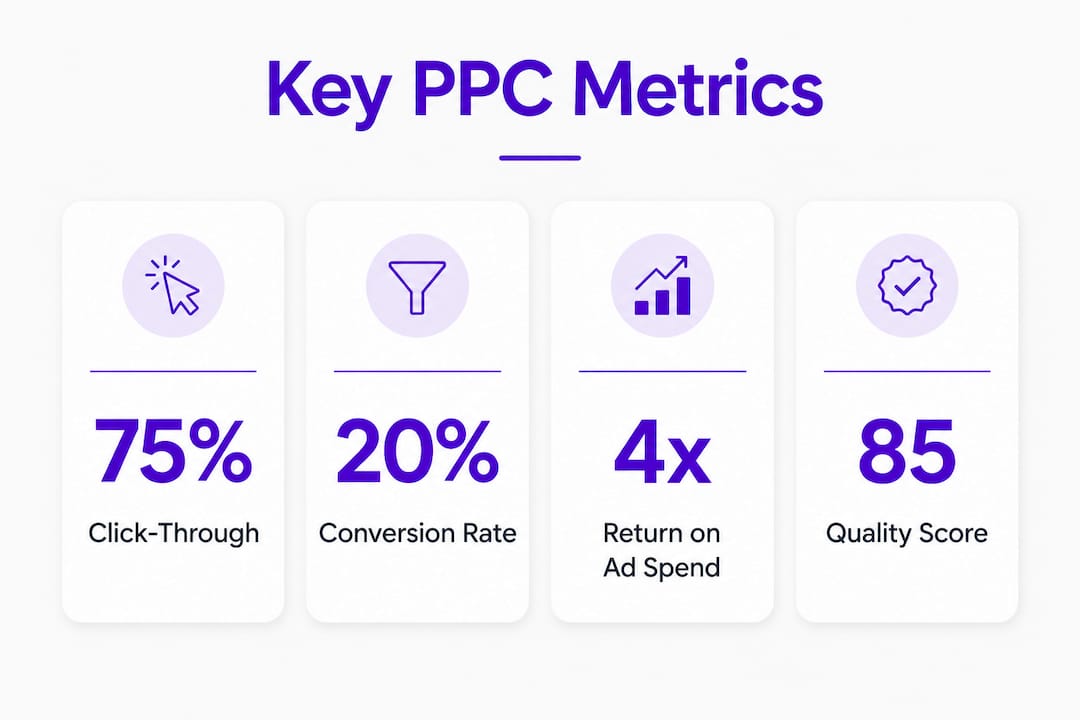
Quality score is Google's rating of the relevance and expected performance of your keywords, ads, and landing pages. A low quality score raises your cost per click and reduces your ad rank. Improving it requires tighter ad group themes, stronger ad copy, and landing pages that match search intent precisely.
Vanity metrics and the denominator problem
Vanity metrics are figures that look impressive but do not connect to business outcomes. Total impressions, total clicks, and raw conversion volume all fall into this category when viewed without context. The denominator problem compounds this: a conversion rate of 10% sounds strong, but if it is calculated from only 20 clicks, it is statistically meaningless. Always check the volume behind any percentage before drawing conclusions.
Pro Tip: Set your primary KPIs before you open the data. Deciding what success looks like in advance prevents you from cherry-picking the metrics that happen to look good on any given week.
How to conduct a rigorous pay-per-click audit
A pay-per-click audit is a structured review of your campaign settings, targeting, bidding, and creative to find inefficiencies and missed opportunities. The audit is not a one-off exercise. It requires a defined rhythm to be effective.
Audit frequency and structure
The most effective auditing schedule separates tasks by urgency and scope:
Weekly: Review search term reports to identify irrelevant queries triggering your ads. Add negative keywords immediately. Check bid adjustments for devices, locations, and audiences. Flag any sudden changes in cost per click or conversion rate.
Monthly: Conduct a full campaign performance review. Assess ad group structure, keyword match types, and landing page alignment. Review budget pacing and identify any campaigns consistently hitting daily caps.
Quarterly: Evaluate account structure against business goals. Reassess audience targeting, ad copy testing results, and bidding strategies. Revisit your KPI targets in light of seasonal trends and market shifts.
UK SMEs typically start PPC budgets between £730 and £1,500 to test initial performance. At that scale, every wasted click matters, which makes the weekly search term review non-negotiable.
Common structural mistakes to fix
Loose ad groups are one of the most persistent problems in PPC accounts. When a single ad group contains dozens of loosely related keywords, ad relevance drops, quality scores fall, and cost per click rises. Tight ad groups with three to five closely related keywords consistently outperform bloated ones.
Broad match misuse is equally damaging. Broad match keywords cast a wide net, which is useful for discovery but expensive when left unmonitored. Without regular negative keyword updates, broad match terms attract irrelevant traffic that inflates spend without generating conversions.
Audit area | What to check | Fix |
|---|---|---|
Search terms | Irrelevant queries triggering ads | Add negatives weekly |
Ad group structure | Too many unrelated keywords per group | Tighten to 3–5 per group |
Landing page match | Ad promise vs page content | Align copy and offer |
Bid adjustments | Device, location, and time of day | Adjust based on conversion data |
Budget pacing | Daily caps hit before end of day | Redistribute or increase budget |
Pro Tip: When prioritising audit fixes, start with the changes that affect the most spend first. A 10% efficiency gain on a £5,000 monthly campaign matters more than the same gain on a £500 one.
What analytical pitfalls distort PPC data interpretation?
Misleading PPC analysis most often arises not from bad data but from misreading good data. Several structural errors consistently trip up even experienced analysts.
Simpson's paradox in campaign data
Simpson's paradox occurs when a trend that appears in aggregated data reverses when the data is broken into sub-groups. In PPC, this means a campaign can show an improving overall conversion rate while every individual ad group within it is actually declining. This happens when a high-volume, high-converting segment grows faster than the others, masking deterioration elsewhere. The fix is to segment data by device, location, audience, and keyword type before drawing any conclusions about overall performance.
Location targeting confusion
Google Ads offers two location targeting settings: "presence or interest" and "presence only." The default setting includes users who show interest in a location, even if they are physically elsewhere. A campaign targeting London will serve ads to users in Edinburgh who recently searched for London services. This inflates geographic reach and distorts location-level performance data. Switching to "presence only" gives you a clean read on where your actual customers are.
Conversion attribution timing
Standard Google Ads reports attribute conversions to the date of the click, not the date the conversion occurred. During periods of rapid change, this creates a blind spot. A campaign that appears to be underperforming this week may simply have conversions that have not yet been attributed. Tracking conversions by conversion time rather than click time gives a more accurate picture of recent performance and prevents false alarms during volatile periods.
"Benchmarking PPC performance against your own historical data is more reliable than comparing against external industry averages. Internal trends reveal whether your account is genuinely improving, regardless of what the market is doing around you."
Isolated metric focus creates tunnel vision. A rising CTR with a falling conversion rate signals a creative problem, not a success. Always read metrics in combination.
Date range misinterpretation is common when comparing periods of unequal length or different seasonal weight. A week in December is not comparable to a week in august.
Denominator blindness leads analysts to celebrate a 50% conversion rate on three clicks. Volume context is not optional.
Advanced strategies for improving PPC profitability
The most significant efficiency gains in PPC come from diagnosing problems that standard dashboards do not surface automatically.
Lost impression share: rank vs budget
Lost impression share measures the percentage of eligible searches where your ad did not appear. The cause matters enormously. Around 54% of eligible UK Google Ads impressions are lost to ad rank, while only 18% are lost due to budget caps. This means the majority of impression loss reflects bid and ad quality problems, not insufficient budget. Increasing spend to fix a rank-related impression share problem is the wrong diagnosis. The correct response is to improve ad relevance, tighten keyword themes, and review landing page quality scores.
The tracking tax
Conversion tracking faults are far more common than most teams realise. At least 56% of accounts have severe tracking issues that distort reported performance figures. The consequence is a "tracking tax": accounts with clean tracking report median returns 2.5 times higher than those with faults. Before drawing any conclusions from ROAS or conversion rate data, audit your tracking setup. Check for duplicate conversion actions, mismatched attribution windows, and any tags that fire inconsistently.
Wasted spend and zero-conversion keywords
Dead search keyword spend reached 16% of total UK Google Ads search spend in Q2 2026, with overall wasted spend at 24%. That represents a significant proportion of budget generating no measurable return. The practical fix is to run a regular zero-conversion keyword report filtered to a meaningful spend threshold. Any keyword spending above that threshold with zero conversions over a 90-day window deserves either a bid reduction, a match type tightening, or removal.
Contribution margin over raw ROAS
Cross-referencing platform data with CRM pipeline data identifies "ghost conversions," which are platform-reported conversions that do not correspond to real pipeline activity. Ghost conversions inflate ROAS and lead to misplaced confidence in underperforming campaigns. Switching the primary profitability metric from raw ROAS to contribution margin forces the analysis to account for product costs, returns, and actual margin. This is particularly important for e-commerce accounts with variable margin products.
Pro Tip: Set up a monthly reconciliation between your Google Ads conversion data and your CRM pipeline. Even a rough comparison will surface ghost conversions and attribution gaps that distort your reported ROAS.
Key takeaways
Effective PPC analysis requires clean tracking, disciplined auditing rhythms, and profitability metrics that go beyond surface-level ROAS.
Point | Details |
|---|---|
Prioritise POAS over ROAS | Profit on ad spend accounts for margins and gives a truer read on campaign profitability. |
Audit on a defined schedule | Weekly search term reviews and monthly full audits catch inefficiencies before they compound. |
Fix tracking before analysing results | At least 56% of accounts have severe tracking faults that reduce reported returns by a factor of 2.5. |
Diagnose impression share loss correctly | Rank-related loss requires structural fixes; budget-related loss requires spend decisions. |
Cross-reference platform and CRM data | Reconciling conversion data removes ghost conversions and improves profitability calculations. |
What I have learnt from years of PPC data
The most common mistake I see in PPC analysis is not a calculation error. It is the habit of opening a dashboard and looking for confirmation rather than contradiction. Teams pull a date range that shows improvement, compare it to a weaker period, and call it progress. The data is not lying. The question is just the wrong one.
The second pattern I keep encountering is over-reliance on automated bidding without understanding what it is optimising for. Smart bidding strategies are only as good as the conversion data feeding them. If your tracking is broken, the algorithm is learning from noise. I have seen accounts where fixing a duplicate conversion tag cut reported conversions in half but doubled actual revenue within two months, because the bidding strategy finally had clean signals to work with.
What actually works is building a structured auditing rhythm and sticking to it even when campaigns appear to be performing well. Complacency is the most expensive state a PPC account can be in. The accounts I have seen deteriorate fastest are the ones where no one looked closely for three months because the numbers seemed fine.
The shift from ROAS to contribution margin is not just a metric preference. It is a change in how you define success. Once you start measuring what the business actually keeps rather than what the platform reports, the entire analysis changes. Campaigns that looked profitable get cut. Campaigns that looked marginal turn out to be the most valuable ones in the account.
Combining platform performance data with CRM pipeline data is the single most underused practice in PPC management. It takes effort to set up, but it removes the guesswork from profitability analysis entirely.
— Amir
Mycontentlab: sharper PPC reporting without the manual work
Marketing teams running PPC campaigns spend a disproportionate amount of time pulling data from multiple sources and formatting it into reports. Mycontentlab automates that process, turning scattered campaign metrics into structured, client-ready reports built on real performance data.
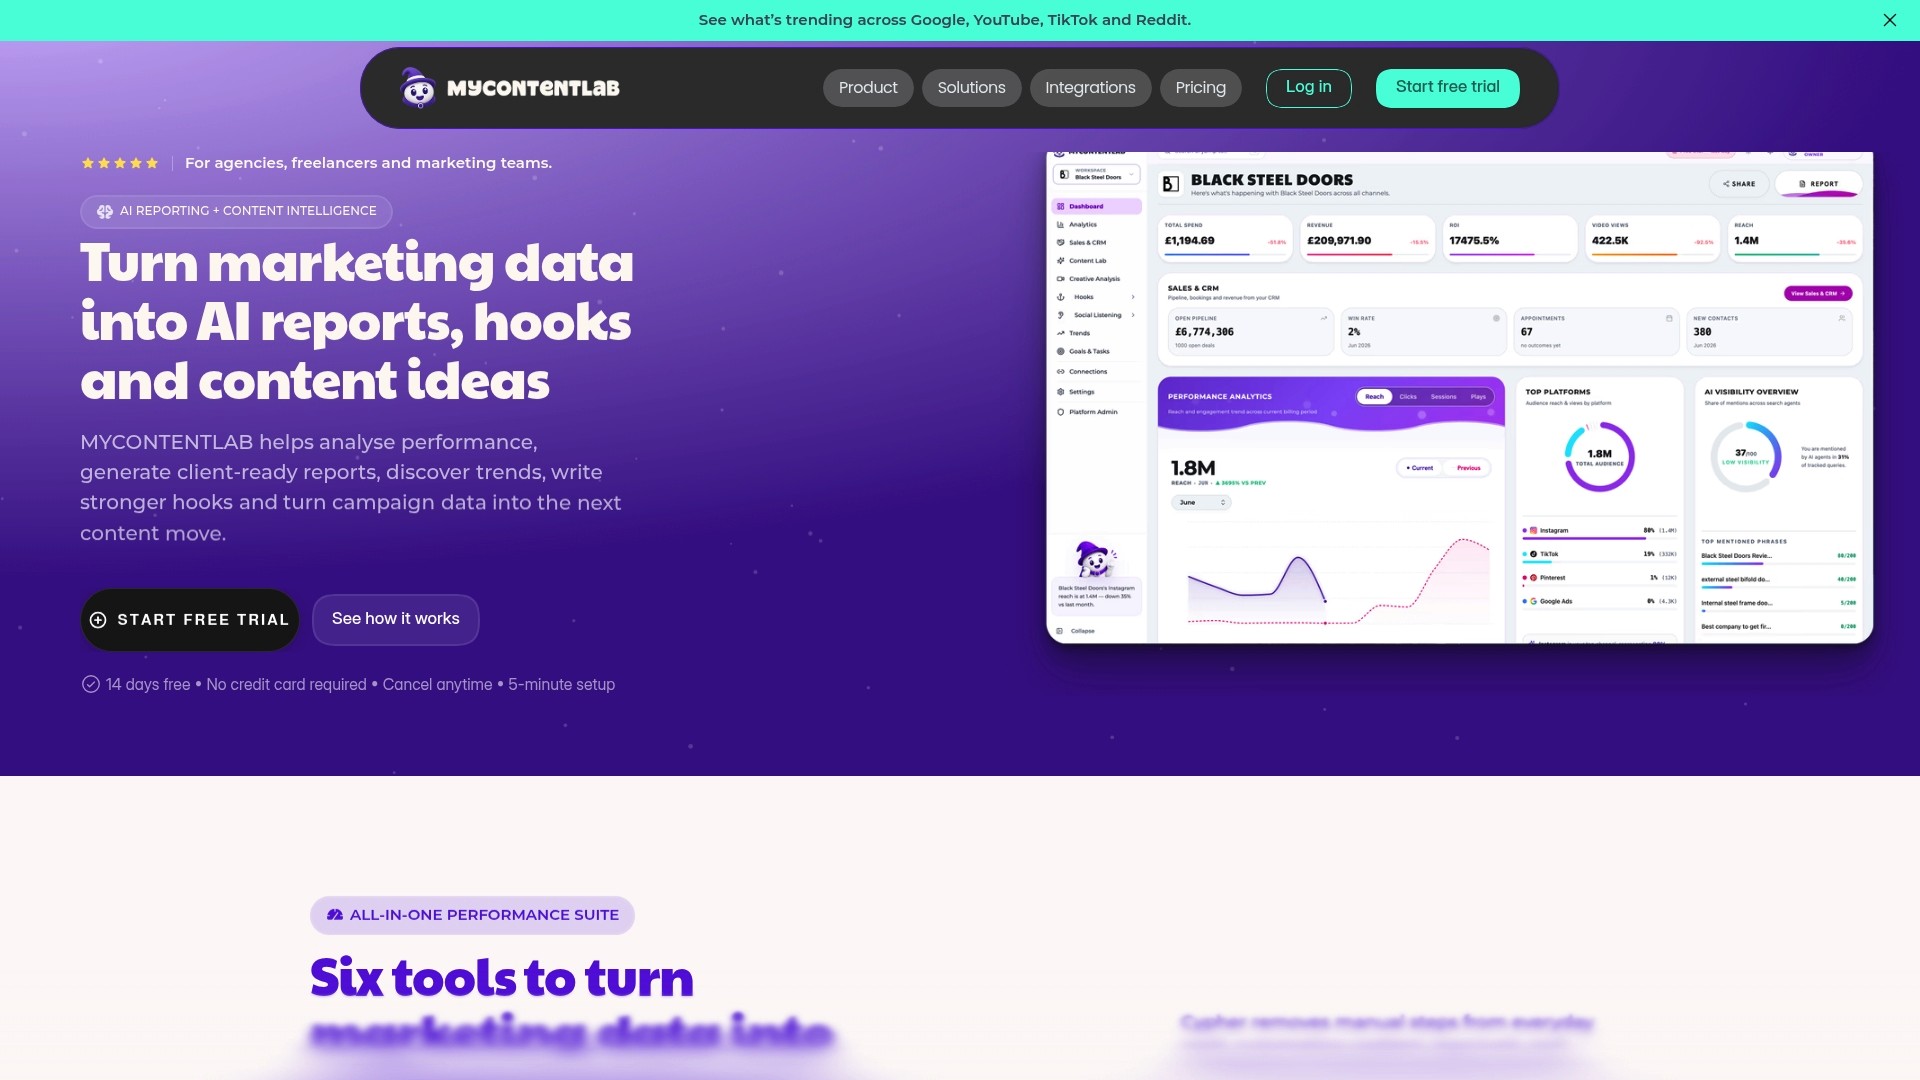
Mycontentlab connects campaign data directly to reporting workflows, so your team spends less time on formatting and more time on analysis. Its AI-powered tools convert raw PPC metrics into content ideas, performance summaries, and recommendations that are ready to share. For agencies managing multiple accounts, the reporting tools at Mycontentlab support the auditing rhythms and KPI tracking that effective PPC management demands. If your current reporting process involves manual exports and spreadsheet assembly, Mycontentlab is worth a close look.
FAQ
What is PPC analysis?
PPC analysis is the systematic review of pay-per-click campaign data to evaluate performance, identify wasted spend, and improve return on investment. It covers metrics including ROAS, conversion rate, cost per acquisition, and impression share.
How often should I conduct a pay-per-click audit?
Search term reports and bid adjustments should be reviewed weekly, with a full campaign audit conducted monthly. Quarterly reviews should assess account structure and KPI alignment against business goals.
What is the difference between ROAS and POAS?
ROAS measures revenue generated per pound of ad spend, while POAS measures profit after accounting for gross margins. POAS gives a more accurate view of true campaign profitability, particularly for businesses with variable product margins.
Why does lost impression share matter in PPC campaign analysis?
Lost impression share reveals how often your ads fail to appear in eligible searches. When the loss is rank-related rather than budget-related, it signals bid or quality score problems that require structural fixes rather than increased spend.
What causes misleading results in PPC data interpretation?
Common causes include Simpson's paradox in aggregated data, conversion attribution lag, location targeting set to "presence or interest" instead of "presence only," and tracking faults that inflate or deflate reported conversion figures.
Recommended


Jul 19, 2026

Search



You can also read
Category
All
Compare
Marketing Reporting
Agency Operations
Content Intelligence
Brand Monitoring
Platform Reporting