Digital marketing reporting: a practical guide for 2026
Discover how digital marketing reporting can transform data into actionable insights. Improve decision-making and drive business results confidently.

TL;DR:
Effective digital marketing reporting links campaign data to business outcomes and provides clear insights. It should be structured around what happened, why it happened, and what actions to take, with reports tailored to each audience's needs. Using a focused set of KPIs, matched reporting cadence, and automation improves decision-making and stakeholder confidence.
Digital marketing reporting is the process of translating raw campaign data into clear, structured insights that guide strategy and demonstrate measurable value to stakeholders. For marketing professionals managing multiple channels, paid search, organic search, social media, and email, a well-built marketing analytics report is the difference between confident decision-making and guesswork dressed up as strategy. The challenge is not collecting data. 75% of marketers say their measurement systems lack the speed, accuracy, and trust needed to justify investment. That gap exists because most teams report activity rather than outcomes.
What makes digital marketing reporting effective?
Effective digital marketing reporting does one thing above all else: it connects marketing activity to business outcomes. A report that lists impressions, clicks, and sessions without explaining what they mean to revenue is a data dump, not a report.
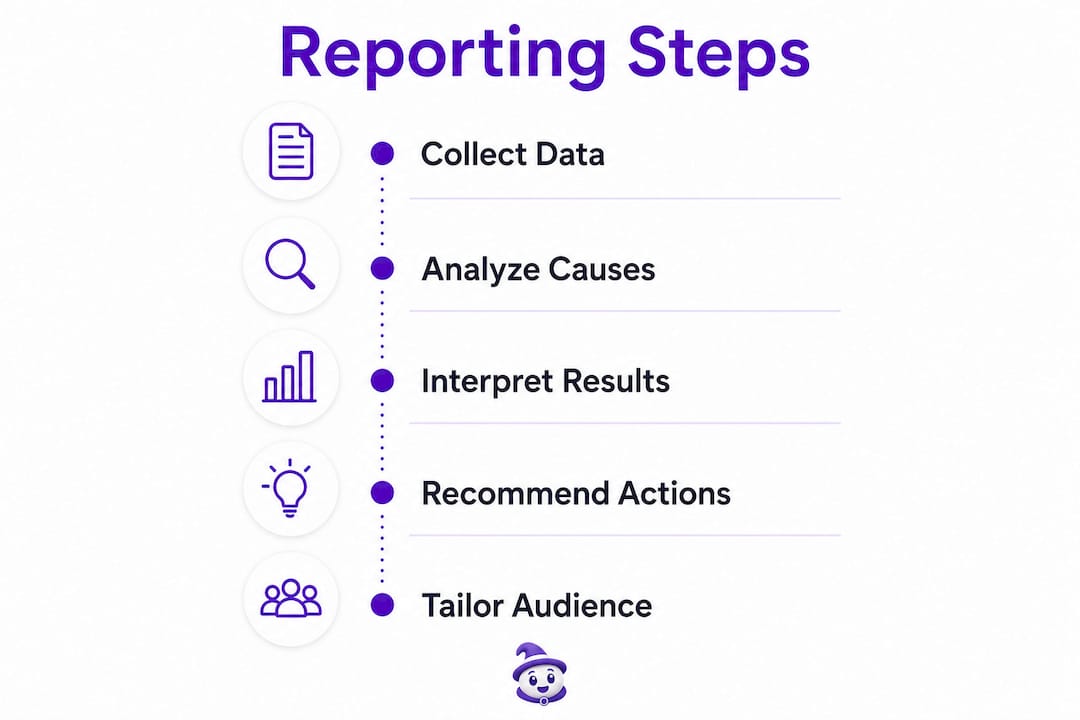
The structure of a strong report follows three questions: what happened, why it happened, and what to do next. A well-built marketing report includes an executive summary, a KPI performance overview, a channel breakdown, budget context, insights, and a clear action plan. Each element earns its place by moving the reader toward a decision.

Tailor the report to the audience
Not every stakeholder needs the same level of detail. Operational teams need granular channel data to act on daily. Leadership needs a performance summary tied to targets. Executives and boards need business outcomes: revenue, return on investment, and growth trajectory.
Mixing these audiences in one report creates confusion. A paid search manager and a chief executive read the same document very differently. The most effective teams build layered reports, a one-page executive summary at the top, with deeper channel analysis available for those who need it.
Limit your dashboard to the metrics that matter
Overloading reports with 40 or more metrics without a clear narrative or next steps leads directly to ineffective reporting. The standard recommendation for executive-level reporting is 8–12 KPIs. That constraint forces prioritisation and makes the report far more useful.
Vanity metrics, such as raw follower counts or total page views without context, inflate reports without informing decisions. Every metric included should answer a question a stakeholder is actually asking.
Reporting cadence: match frequency to purpose
Industry-standard reporting cadences are weekly, monthly, and quarterly, each serving a different decision level. Weekly reports support tactical optimisation: budget pacing, ad creative performance, and bid adjustments. Monthly reports provide performance oversight across channels. Quarterly reports feed into strategic planning and board reviews.
UK agencies typically target reporting within 10 working days after month-end, with financial KPI targets including gross margins of 60–70% and EBITDA targets of 20–25%. Meeting those targets requires timely, accurate reporting, not reports assembled three weeks after the period closes.
Pro Tip: Use four-week rolling averages rather than week-on-week comparisons for tactical metrics. Weekly KPI fluctuations are often statistical noise. Rolling averages reveal genuine trends and prevent unnecessary strategy changes based on a single bad week.
Which KPIs should marketing teams track and report?
A metric measures activity. A KPI measures progress toward a specific business goal. The distinction matters because most marketing teams track dozens of metrics but report very few true KPIs.
The seven KPIs that connect marketing to revenue
Seven core KPIs cover the full customer journey from awareness to revenue for UK businesses and global teams alike:
Customer acquisition cost (CAC): The total spend divided by the number of new customers acquired. Rising CAC signals inefficiency in the acquisition funnel.
Return on ad spend (ROAS): Revenue generated per pound spent on advertising. A ROAS below 1.0 means the campaign is losing money.
Conversion rate: The percentage of visitors or leads who complete a desired action. Even a 0.5% improvement in conversion rate compounds significantly at scale.
Customer lifetime value (CLV): The total revenue a customer generates over their relationship with the business. CLV justifies higher CAC for high-value customer segments.
Click-through rate (CTR): The ratio of clicks to impressions. Low CTR in PPC campaign analysis signals weak ad creative or poor audience targeting.
Cost per lead (CPL): The spend required to generate one qualified lead. CPL is the primary efficiency metric for lead generation campaigns.
Attribution: The model that assigns credit to touchpoints in the conversion path. Attribution determines which channels receive budget, making it the most consequential KPI of all.
Setting targets that mean something
KPI targets set without historical context are arbitrary. The correct method is to use 12 months of historical data to establish a baseline, then set targets that reflect realistic improvement. Industry benchmarks from sources such as the IAB provide useful reference points, but internal trends are more reliable for target-setting than sector averages.
Translating KPIs into business language
Marketing teams succeed when they translate KPIs into the language leadership already uses. A chief financial officer does not think in CTR. They think in revenue per customer, payback period, and margin. Reframing a conversion tracking report as "we acquired 340 new customers at an average CAC of £42, against a CLV of £380" is far more persuasive than reporting a 3.2% conversion rate in isolation.
UK GDPR and broader data privacy regulations have also complicated attribution. Third-party cookie deprecation limits cross-site tracking, which means last-click attribution models increasingly misrepresent the true customer journey. Teams should move toward first-party data models and privacy-safe measurement frameworks.
Pro Tip: Build a one-page KPI translation sheet for leadership. Map each marketing metric to its business equivalent. "CTR" becomes "ad relevance score." "CPL" becomes "cost to fill the sales pipeline." This single document removes the most common source of friction between marketing and the board.
How to overcome common reporting pitfalls
Data fragmentation is the leading cause of reporting failure. When Google Ads, Meta, your CRM, and your email platform each report conversions differently, you end up with competing truths. A sale appears four times across four platforms, and your total reported ROAS looks far better than reality.
Governance and shared definitions
The fix for fragmentation is governance, not more tools. Every data source needs a shared definition for core events: what counts as a conversion, how sessions are attributed, and which touchpoints are included in the customer journey. Without these definitions, cross-channel analysis is unreliable regardless of the software used.
Data fragmentation requires cross-vendor calibration and transparent attribution models. Black-box attribution, where the platform assigns credit using undisclosed logic, makes it impossible to audit results or build confidence in the numbers. Transparent models, whether last-click, linear, or data-driven with documented methodology, are always preferable.
The vanity metrics trap
Reporting metrics that look impressive but do not connect to decisions is a common failure mode. Total impressions, social media followers, and raw traffic volume are the most frequent offenders. They are not useless, but they become misleading when reported without context or without linking them to outcomes.
"Reports fail when they provide mere data dumps without a clear narrative or next steps. Structuring around what happened, why it happened, and what to do next is the difference between a report that drives action and one that gets filed and forgotten."
The solution is to ask one question before including any metric: "What decision does this number inform?" If the answer is "none," remove it.
Automation and anomaly detection
Marketing reporting should be an ongoing discipline, not a periodic formality. Automated anomaly detection and real-time alerts allow teams to respond to performance changes between scheduled reports. A sudden drop in conversion rate on a Wednesday morning should not wait until the monthly review to be addressed.
Pro Tip: Set automated alerts for your three most critical KPIs. Define thresholds: for example, if ROAS drops below 2.0 or CPL rises more than 20% week-on-week, trigger an immediate review. This turns reporting from a retrospective exercise into a live performance management system.
What reporting frameworks actually work in practice?
A structured report format removes ambiguity and makes every report faster to produce and easier to read. The four-part framework used by high-performing marketing teams covers: executive summary, KPI overview, channel analysis, and next steps.
The four-part report structure
The executive summary is one page maximum. It states performance against targets, highlights the single most important finding, and names the recommended action. Boards care about business outcomes, not channel metrics. Lead with revenue impact.
The KPI overview presents the 8–12 agreed metrics against their targets. Use a simple traffic-light system: green for on-target, amber for within 10% of target, red for underperforming. This format lets a reader assess overall performance in under 30 seconds.
The channel analysis goes deeper. For a PPC campaign analysis, this means ROAS by campaign, CTR by ad group, and CPL by audience segment. For SEO reporting, it means organic traffic by landing page, keyword ranking movement, and conversion rate from organic sessions. For email marketing analysis, it means open rate, click rate, and revenue per email sent.
The next steps section is the most neglected part of most reports. It should list three to five specific actions, name the owner of each action, and set a deadline. Without this section, a report is a historical document. With it, the report becomes a management tool.
Cadence matched to campaign type
Different campaigns require different reporting rhythms. Always-on paid search campaigns benefit from weekly digital campaign performance reviews. Brand awareness campaigns running over three months are better assessed monthly, since short-term fluctuations in reach and frequency metrics are rarely meaningful. Seasonal campaigns need a pre-campaign baseline, a mid-campaign check, and a post-campaign debrief.
The table below shows how report format maps to reporting purpose:
Report type | Cadence | Primary audience | Core focus |
|---|---|---|---|
Tactical performance | Weekly | Channel managers | Budget pacing, bid efficiency, creative performance |
Performance overview | Monthly | Marketing leadership | KPI progress, channel contribution, spend efficiency |
Strategic review | Quarterly | Board and executives | Revenue impact, CLV trends, budget allocation |
Campaign debrief | Post-campaign | All stakeholders | ROI, learnings, and recommendations for next campaign |
Automation tools, whether entry-level reporting platforms or enterprise analytics suites, reduce the time spent assembling data and increase the time available for analysis. Real-time anomaly detection and automated notifications mean teams spend less time building spreadsheets and more time acting on findings.
Connect all data sources to a single reporting layer to eliminate manual data pulls.
Schedule automated report delivery to stakeholders at the agreed cadence.
Use dashboard templates that separate executive views from operational detail.
Review and update KPI targets quarterly to reflect changing business priorities.
Key takeaways
Effective digital marketing reporting requires a clear structure, a limited set of business-relevant KPIs, and a consistent cadence that matches each stakeholder's decision-making needs.
Point | Details |
|---|---|
Structure every report clearly | Use the four-part format: executive summary, KPI overview, channel analysis, and next steps. |
Limit KPIs to 8–12 per report | Focused reports drive better decisions than dashboards overloaded with 40-plus metrics. |
Match cadence to purpose | Weekly for tactical optimisation, monthly for oversight, quarterly for strategic planning. |
Translate metrics into business language | Reframe CTR and CPL as revenue and pipeline cost to align with leadership priorities. |
Treat reporting as a live discipline | Automated alerts and anomaly detection catch performance issues between scheduled reviews. |
Why most marketing reports fail to change anything
I have reviewed hundreds of marketing reports over the years, and the pattern is consistent. The reports that get ignored are the ones that lead with data. The reports that change budgets, shift strategy, and earn marketing a seat at the board table are the ones that lead with a story.
The most common mistake I see is treating the report as proof of work. Teams spend hours building beautiful dashboards filled with every metric the platform can export, then wonder why the chief executive skims it in 90 seconds and asks no questions. The answer is that the report answered questions nobody was asking.
The shift that changes everything is moving from "here is what we did" to "here is what we learned and here is what we are doing about it." That reframe turns a compliance document into a leadership tool. It also changes how marketing is perceived internally. Teams that report in business language, revenue, margin, payback period, and customer value, get treated as business partners. Teams that report in channel metrics get treated as a cost centre.
Reporting frequency is another area where I see teams get it wrong. More reports do not mean better decisions. A weekly report that contains no new insight is noise. A monthly report with a clear narrative and three specific recommendations is worth far more. Quality of insight beats volume of output every time.
The practical advice I give every team is this: before you build the report, write the headline. If you cannot summarise the period's performance in one sentence, you do not yet understand the data well enough to report it. That discipline forces clarity and almost always improves the final report.
— Amir
How Mycontentlab helps teams report with clarity and confidence
Marketing teams that produce clear, client-ready reports consistently win more trust and retain more clients. The challenge is that assembling those reports manually, pulling data from multiple platforms, formatting it, and writing the narrative, takes hours that most teams do not have.
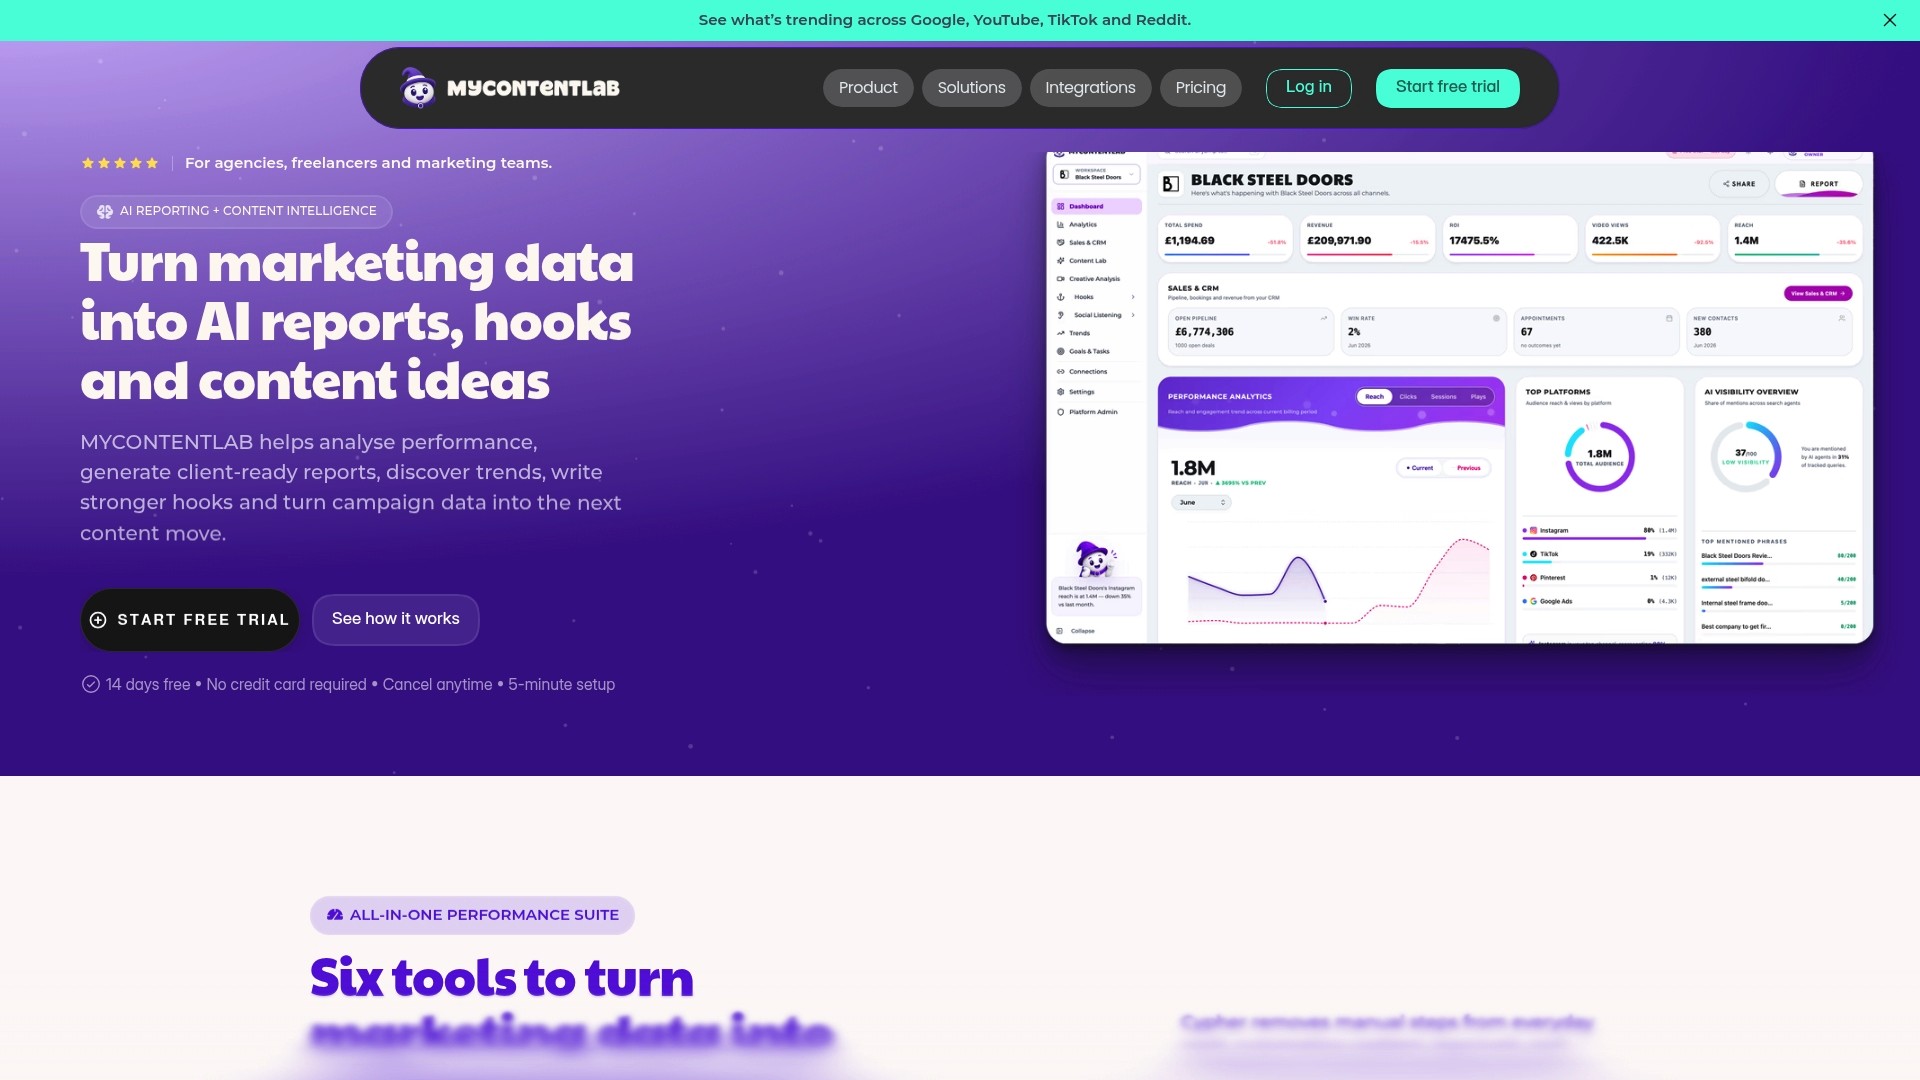
Mycontentlab is built for agencies, freelancers, and in-house teams who need to turn scattered performance data into polished, structured reports without the manual overhead. Its AI-powered tools convert raw metrics into written insights, highlight anomalies automatically, and generate content recommendations directly from campaign performance data. Teams using Mycontentlab report faster turnaround on client reporting workflows and sharper communication with stakeholders. For marketing professionals who want to spend less time building reports and more time acting on them, Mycontentlab's reporting platform is worth exploring.
FAQ
What is digital marketing reporting?
Digital marketing reporting is the process of collecting, analysing, and presenting campaign performance data to inform marketing decisions and demonstrate value to stakeholders. A strong report covers KPIs, channel performance, budget efficiency, and recommended next steps.
How many KPIs should a marketing report include?
Executive-level reports should focus on 8–12 KPIs. Overloading reports with 40 or more metrics without a clear narrative reduces the report's usefulness and makes it harder for leadership to act.
How often should marketing teams report performance?
Weekly reports support tactical optimisation, monthly reports provide performance oversight, and quarterly reports feed strategic planning. The cadence should match the decision-making needs of the audience receiving the report.
What is the biggest challenge in online marketing reporting?
Data fragmentation is the primary cause of unreliable reporting. When multiple platforms report the same conversion differently, teams end up with competing figures. Governance, shared definitions, and transparent attribution models resolve this.
How does GDPR affect marketing attribution?
UK GDPR limits third-party tracking, which reduces the accuracy of cross-channel attribution models. Teams should prioritise first-party data collection and use privacy-safe measurement frameworks to maintain reliable conversion tracking reports.


Jul 19, 2026

Search



You can also read
Category
All
Compare
Marketing Reporting
Agency Operations
Content Intelligence
Brand Monitoring
Platform Reporting